Discover and token pages
Find trending tokens, then read a token's chart, holders, top traders, developer history and safety signals before you trade.
Discover
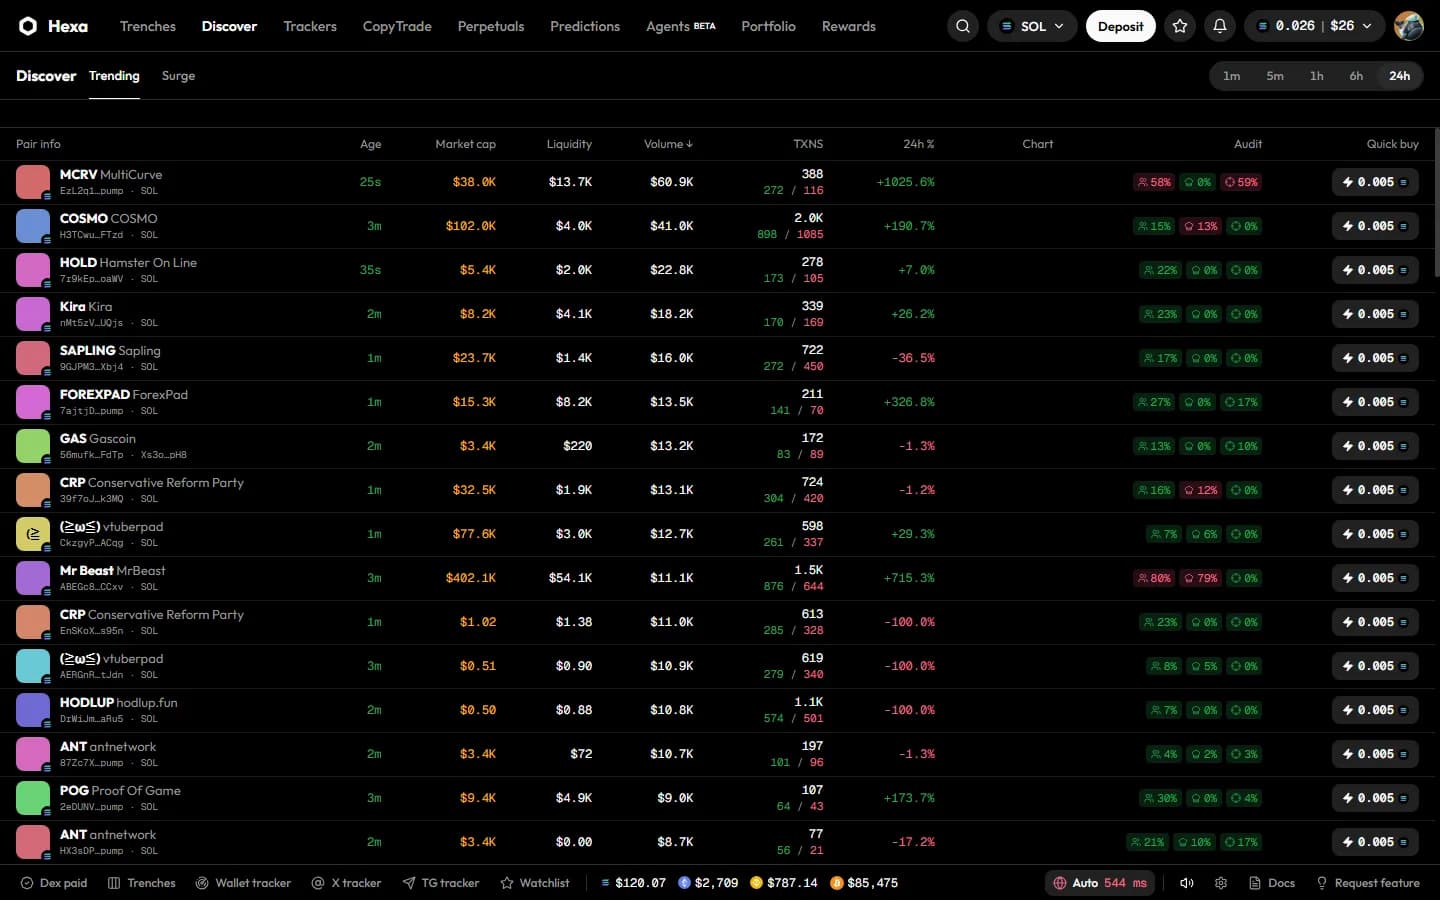
Discover ranks tokens that are moving now. The list refreshes every 15 seconds.
| Tab | Shows |
|---|---|
| Trending | Tokens ranked by volume and buyers over the window you pick (1m, 5m, 1h, 6h or 24h) |
| Surge | Tokens whose price is surging right now |
| DEX Screener | Tokens with a paid DexScreener profile |
| Pump Live | pump.fun tokens that are streaming live |
Some tabs depend on the data source and may be empty or hidden on some chains.
Each row shows the pair, age, market cap, liquidity, volume, transactions, the change over the window, a small chart and audit flags, and a Quick buy button that buys at once with your ⚡ amount and active preset.
Search
Press / or Ctrl+K (⌘K on a Mac) anywhere to search for a token, contract address, wallet or page. The chain chips at the top narrow the search to one chain (Tab with the arrow keys switches chain). With an empty search you see your recent picks and the last 24 hours' trending tokens.
The token page
Header
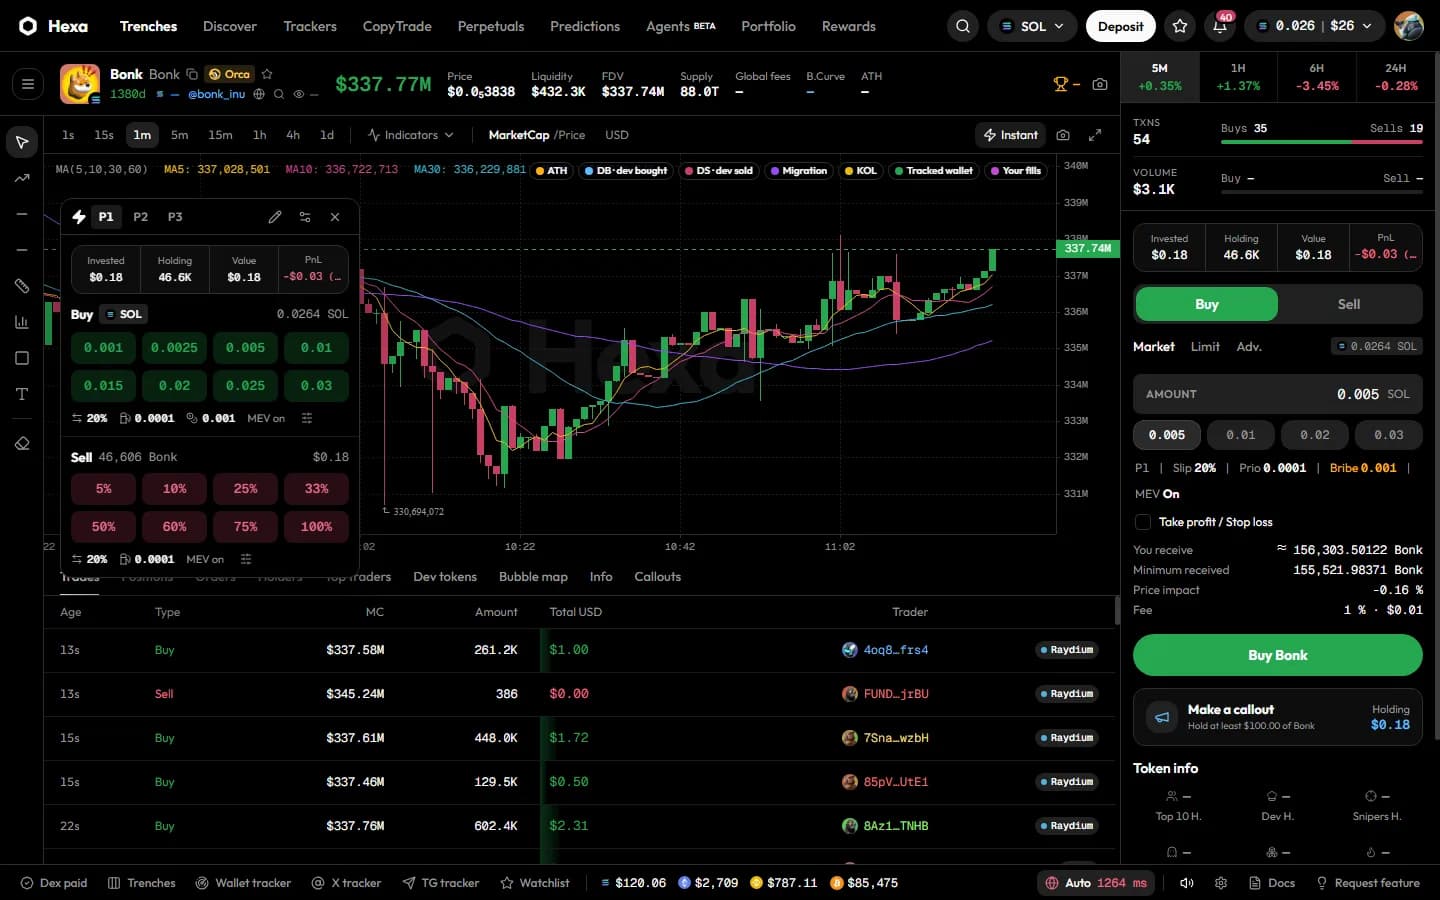
The header shows price, liquidity, FDV, supply, global fees paid on the token, bonding-curve progress and the all-time high. Next to the name: copy the contract address, add the token to your watchlist (the star), the launchpad badge, and the camera icon for a shareable PnL card.
Warning banners appear when something needs your attention: the token can't be sold or has a high sell tax, the mint or freeze authority is still active (on EVM: the owner can mint or pause), or liquidity is low. Each can be hidden for the session.
Chart
- Timeframes from 1s to 1d (the shortest available depends on the chain), in market cap or price, in USD or the native coin.
- Indicators: MA, EMA, BOLL, VOL, MACD and RSI.
- Drawing tools: trend line, ray, horizontal and price lines, Fibonacci, rectangle and notes.
- Marks on the chart for the all-time high, the developer's buys (DB) and sells (DS), the migration, KOL and tracked-wallet trades, and your own fills.
- Screenshot and full-screen buttons, and Instant for the Instant panel.
Side panel
- Activity for 5 minutes, 1 hour, 6 hours and 24 hours: transactions and volume, split into buys and sells.
- Token info: top-10 holders' share, developer holding (or Sold), snipers, insiders, bundlers, LP burned, holders, pro traders and whether DexScreener is paid.
- Audit chips: LP burnt, no mint, no blacklist, not a honeypot. On EVM chains the audit comes from GoPlus.
Tabs under the chart
| Tab | What it shows |
|---|---|
| Trades | Every trade with its age, side, market cap, amount, value and trader. Trades placed through Hexa are highlighted |
| Positions | Your position in this token |
| Orders | Your open orders on this token, with Cancel |
| Holders | Top holders with their share, value, first buy and tags (dev, sniper, insider, bundler, whale, KOL, pool, burn). Track follows a wallet |
| Top traders | Who made and lost the most on the token, with what they still hold |
| Dev tokens | The creator's other launches: how many migrated and how many rugged |
| Bubble map | Holders as bubbles, linked by transfers between them, to spot clusters controlled by one party |
| Info | Supply, decimals, launchpad, quote token, mint and freeze authority, LP burned, tax, pool, creator, creation time, rug score and socials |
| Callouts | Posts from traders about this token |
Signals, not guarantees
Audit flags, holder tags and warnings reduce some risks; they don't remove them. New tokens can still go to zero.
Watchlist and PnL card
- Star a token to add it to your Watchlist (bottom bar), up to 200 tokens.
- The PnL card turns your result on a token into an image: choose one of the backgrounds, then Download, Copy image or Share on X.